Part 1
Tell Me What You Watch and I Will Tell You What You Ae.
I’m Masafumi Fujihara of Hakuhodo DY Media Partners. I’m currently with the Institute of Media Environment, where I conduct broad, in-depth research on how sei-katsu-sha and media interact. I’d like to offer a few observations about sei-katsu-sha and media based on the Seikatsu Teiten data, to which the results of the 2016 survey have now been added.
Today we live in an information society — or rather an information-overloaded society, perhaps. According to the Fixed-point Media Survey 2016 released by the Institute of Media Environment, people in the Tokyo region now spend more time than ever — 393.8 minutes a day — consuming media. That means that for more than six and a half hours every day we’re glued to our TVs, newspapers, magazines, radios, computers, and mobile devices.
And that figure represents only the time spent consuming these six media of which people are fully aware. It does not include exposure to, for example, digital signage on trains or outdoor video screens on the street. Once these are factored in, it could be said that people today are ceaselessly bombarded with information during their waking hours. It’s thus no exaggeration to say that modern sei-katsu-sha constitute the ultimate audience in that they are constantly being fed information.
On the other hand, however, we must also keep in mind that sei-katsu-sha are not mere mechanical recipients of information. Give a command to a computer, and it will store and process data, whether language, audio, or video, exactly as instructed. But sei-katsu-sha aren’t the kind of entities that store and process the information they’re given exactly as they’re told. Rather, because there’s such a mass and variety of information out there, they pick and choose their information (sources), and they interpret each item of information for themselves by connecting it with other things before translating it into action. Thus sei-katsu-sha qua audience can be defined as active recipients (which I think may be a contradiction in terms [LOL]).
It can therefore be argued that sei-katsu-sha’s information behavior and their daily attitudes and behavior form two sides of the same coin. Identifying the hidden connections between them can provide us with clues to understanding the way the wind is blowing and the tide of the times.
But I’ve gone on long enough with preliminaries. If you want to really find out what I’m talking about, the Seikatsu Teiten website set up by the Hakuhodo Institute of Life and Living is invaluable. The “Possibly Similar Graphs” section in particular offers some fascinating leads in an intuitive fashion.
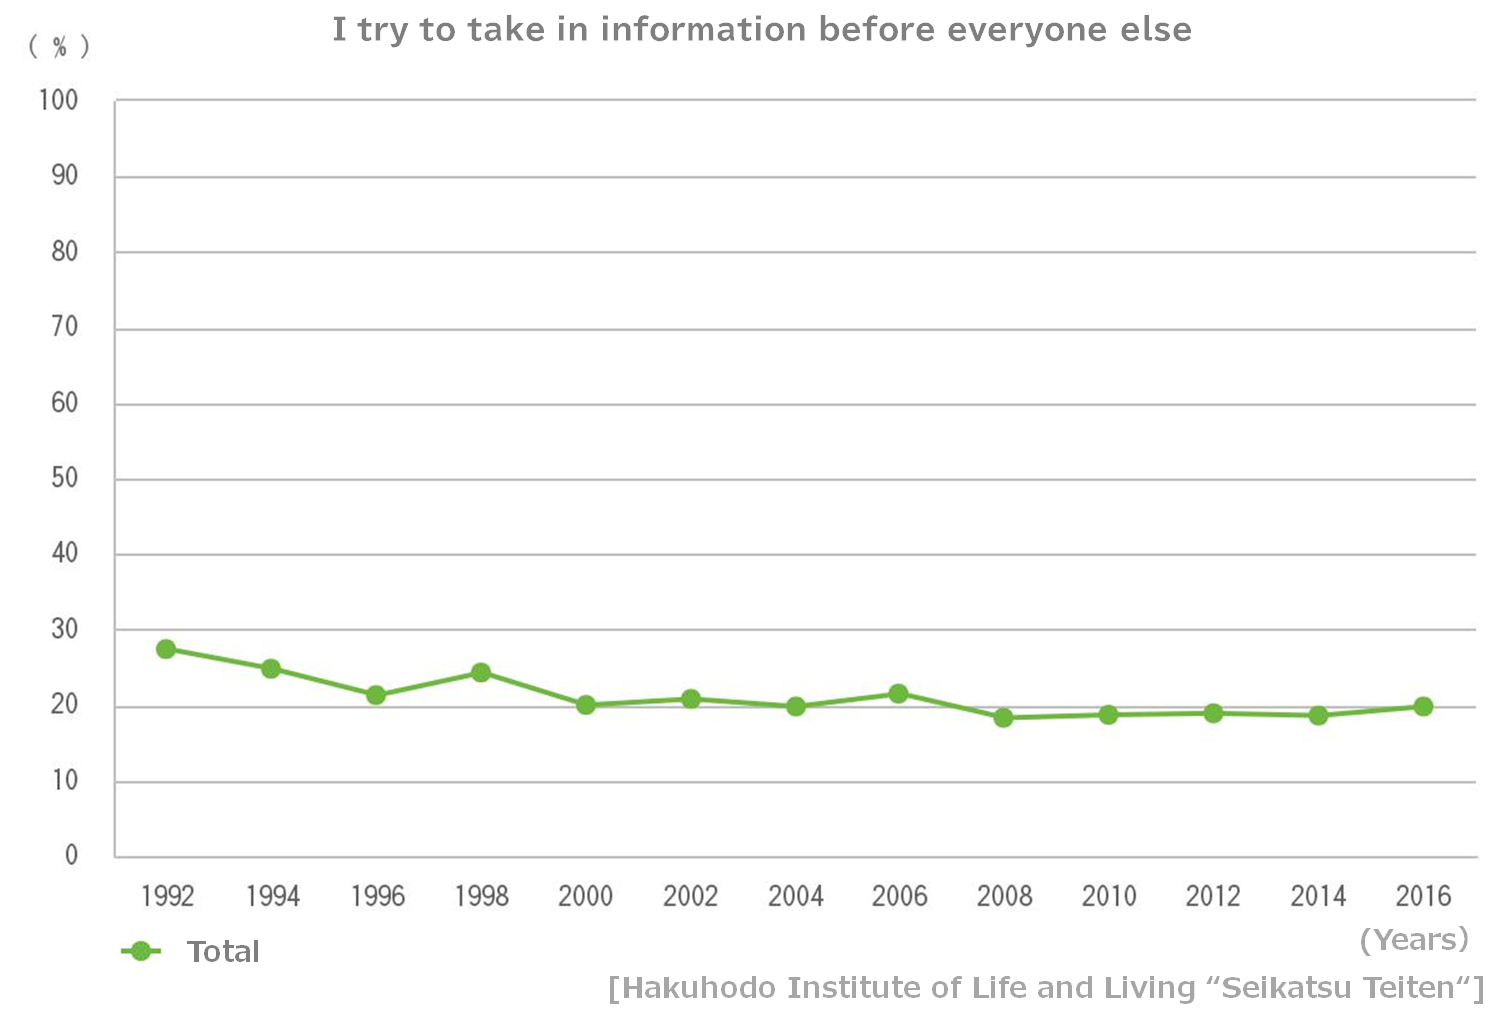
For instance, the percentage of people who try to take in information before everyone else has slowly but steadily diminished over the long term, from 27.4% in in 1992 to 19.8% in 2016 — surprise, surprise, given the plethora of information out there. It may be that with the excessive proliferation of information, sei-katsu-sha today have lost confidence in their ability to keep up.
But I was intrigued to discover that there was a possibly similar graph showing a parallel trend with regard to one aspect of propensity to invest, namely people who feel no aversion to using foreign financial institutions and financial instruments. Thus sei-katsu-sha eager for new information are these days roughly identified with people attuned to investment information.

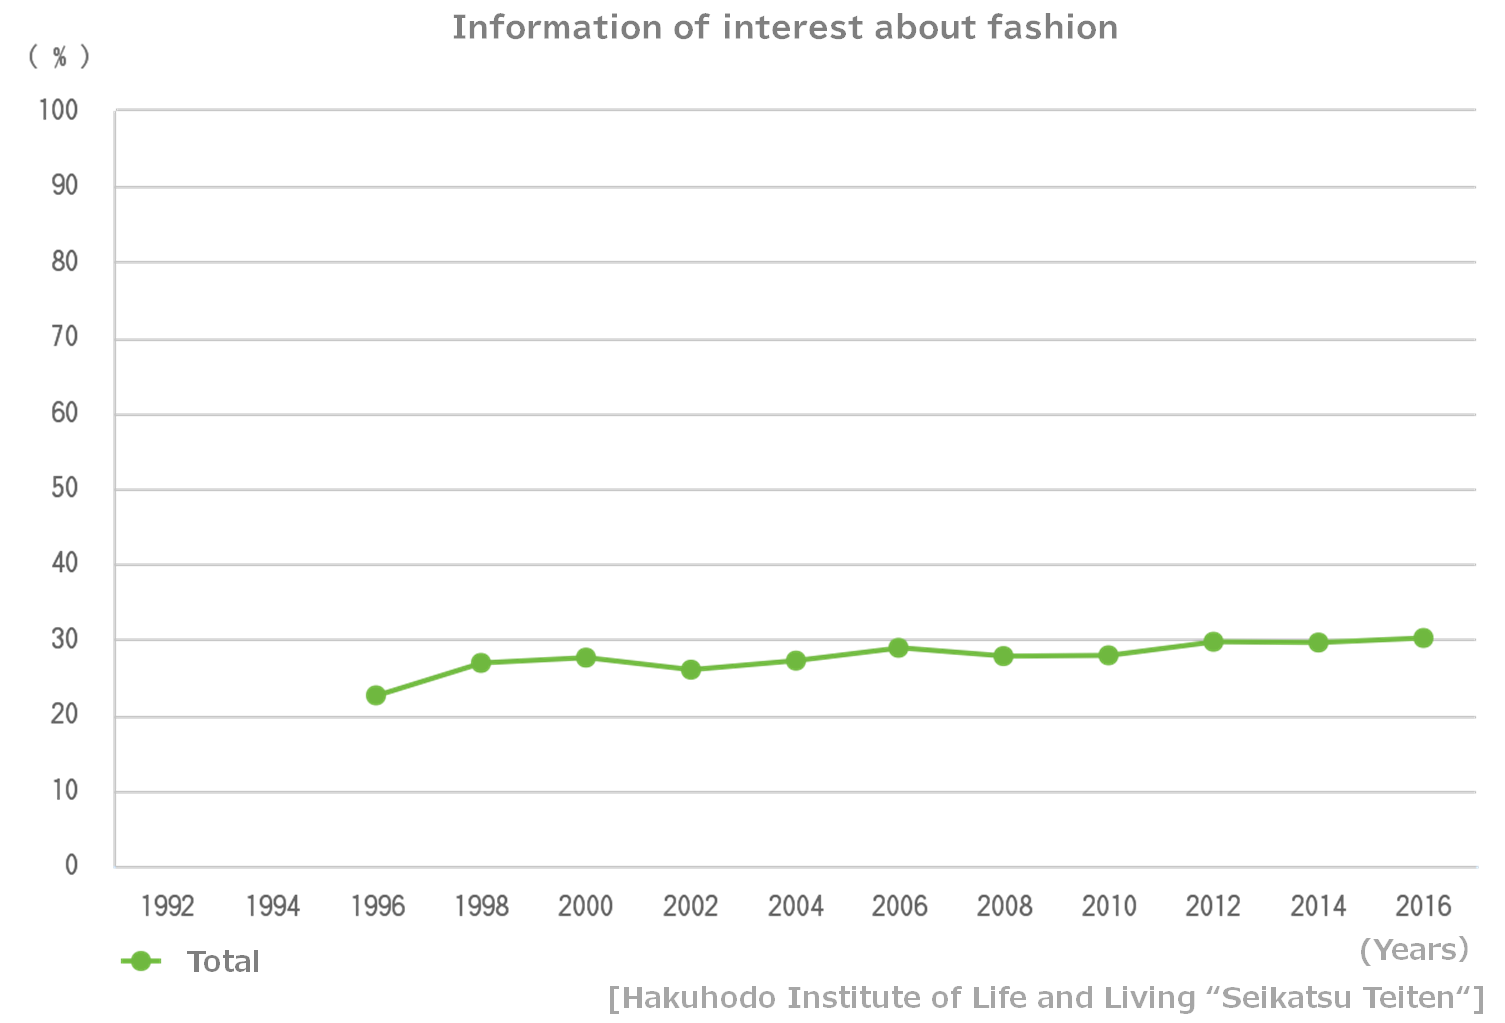
On the other hand, the number of sei-katsu-sha answering “fashion information” to the question “What types of information are you interested in?” has conversely risen over the same period, from 22.6% in 1996 to 30.2% in 2016, crossing the 30% mark for the first time. Factoring that in and thinking creatively, it may be that for sei-katsu-sha today, new information means practical stuff such as economic and financial information and is perceived to differ from “fads and trends,” which includes fashion (and which has also crept up, from 16.9% in 1996 to 26.1% in 2016). In this day and age it may more apt to say that “Information is Money” than “Time is Money.”
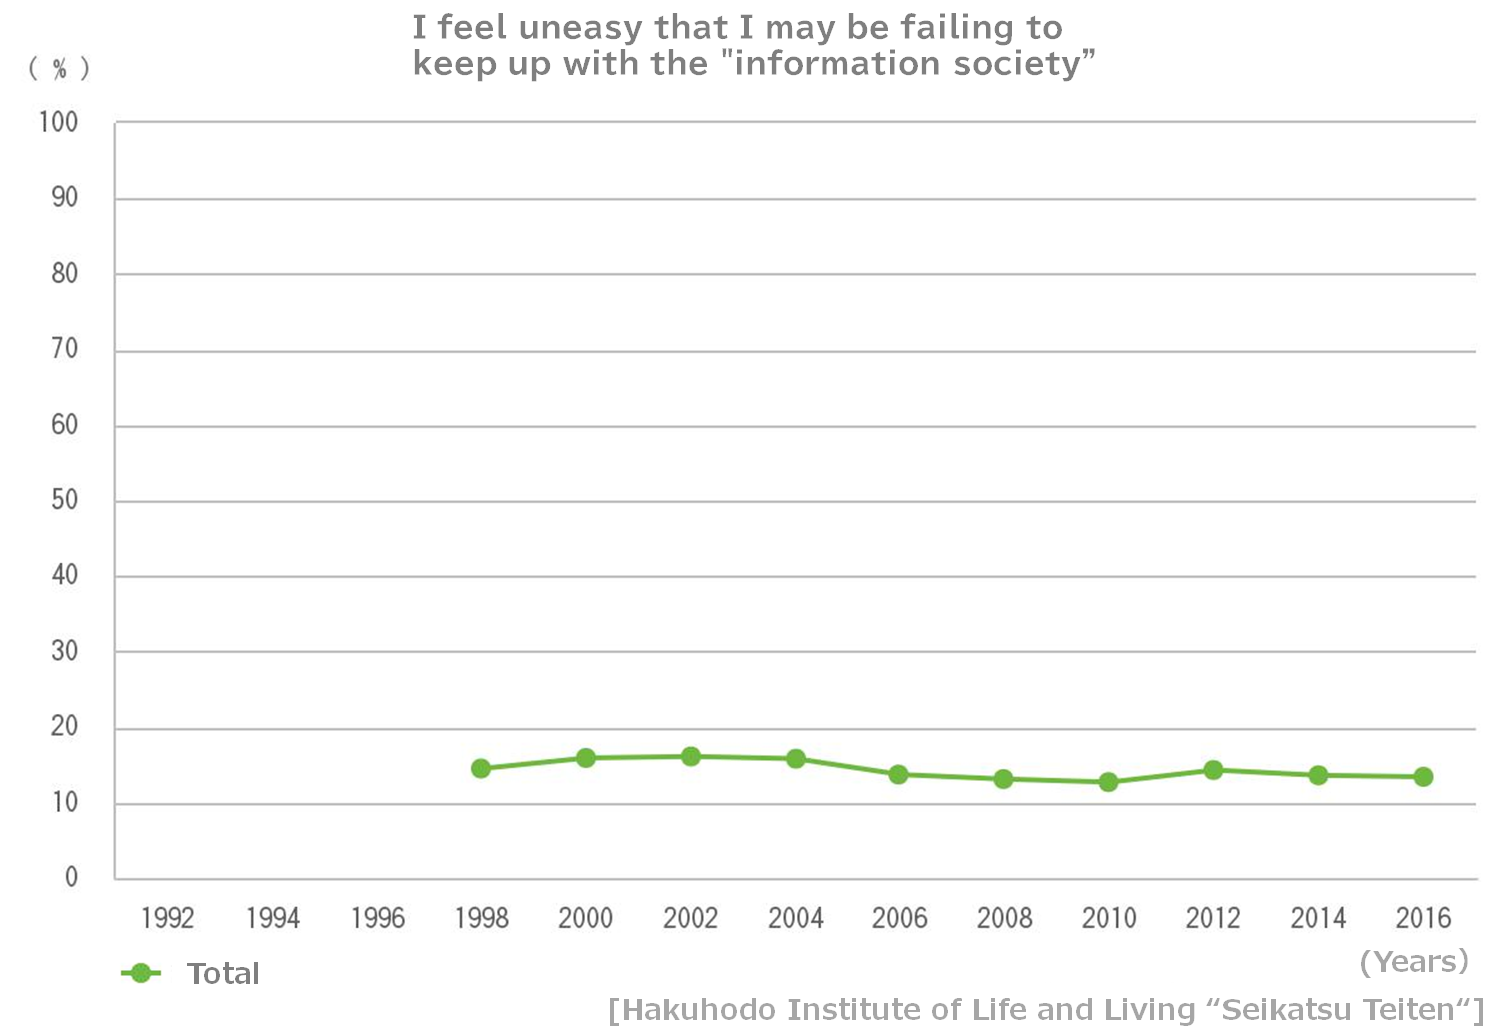
Now let’s take a look at other data on information. Whereas the motivation to take in new information appears to be slowly declining, the percentage of people who feel uneasy that they may be failing to keep up with the information society has flatlined overall. So it seems that the general attitude among people these days is that even though they may not have the latest information, they’re still somehow managing to stay in the swim of things.
However, a look at possibly similar graphs reveals some slight variations on this question by sex and age. For example, among males aged 30-39, the trend line resembles that for respondents who basically like work. On the other hand, among females aged 50-59, the trend line resembles that for respondents who have attended a hobby or sports class or taken lessons in the past year, and those willing to spend money on everyday meals.
These data can perhaps be interpreted this way. Men in their thirties devoted to their careers have sudden attacks of anxiety about falling out of step with society. Women in their fifties seek to allay their concerns about falling behind the times by taking up a hobby or sport or jazzing up their everyday meals. That surely is something like the true state of sei-katsu-sha today.


We can’t talk about sei-katsu-sha in figures alone. If we wish to accurately talk about sei-katsu-sha, it’s not enough to look merely at how much each percentage has risen or fallen; we also need to examine how those figures interrelate and describe the lifestyle background behind them.
But resemblances between data and causation are two different things. A resemblance between graphs is nothing more than a resemblance; naturally there’s a limit to how much can be accurately said on that basis. Still, while always keeping that in mind, using a little imagination to spice up apparent resemblances between plotted data on different survey items that at first sight seem completely unrelated is, I feel, a valid method of getting a step closer to sei-katsu-sha.
So we need to talk about communication and its background rather than about information (data). Big data is sweeping over us as over the sei-katsu-sha of today’s information-overloaded society, and what we now require is a vision of sei-katsu-sha, and a method of communication, rooted in that viewpoint.
A French lawyer famed as an epicure once said, “Tell me what you eat and I will tell you what you are.” I’m ready to take a fresh look at the Seikatsu Teiten data in order to become the kind of media researcher who can truly say, “Tell me what you watch and listen to and I will tell you what you are.”


